Platform Trial with Arm Added Midway
2026-05-29
platform_study.RmdIntroduction
This vignette demonstrates how appendMCP handles a
platform-type group sequential design in which a new
treatment arm is added midway through an ongoing trial. The design
pattern illustrated here extends the standard two-arm group sequential
framework described in the example_study_report vignette to
accommodate:
- A 3-arm structure (TrtA monotherapy, TrtAB combination, Control) where TrtAB is added after the trial has already started enrolling TrtA vs Control;
- A biomarker stratification (B+ / B−) that is a genuine patient subgroup of clinical interest;
- Two control-arm pooling strategies — pooled and concurrent — for the TrtAB vs Control comparison;
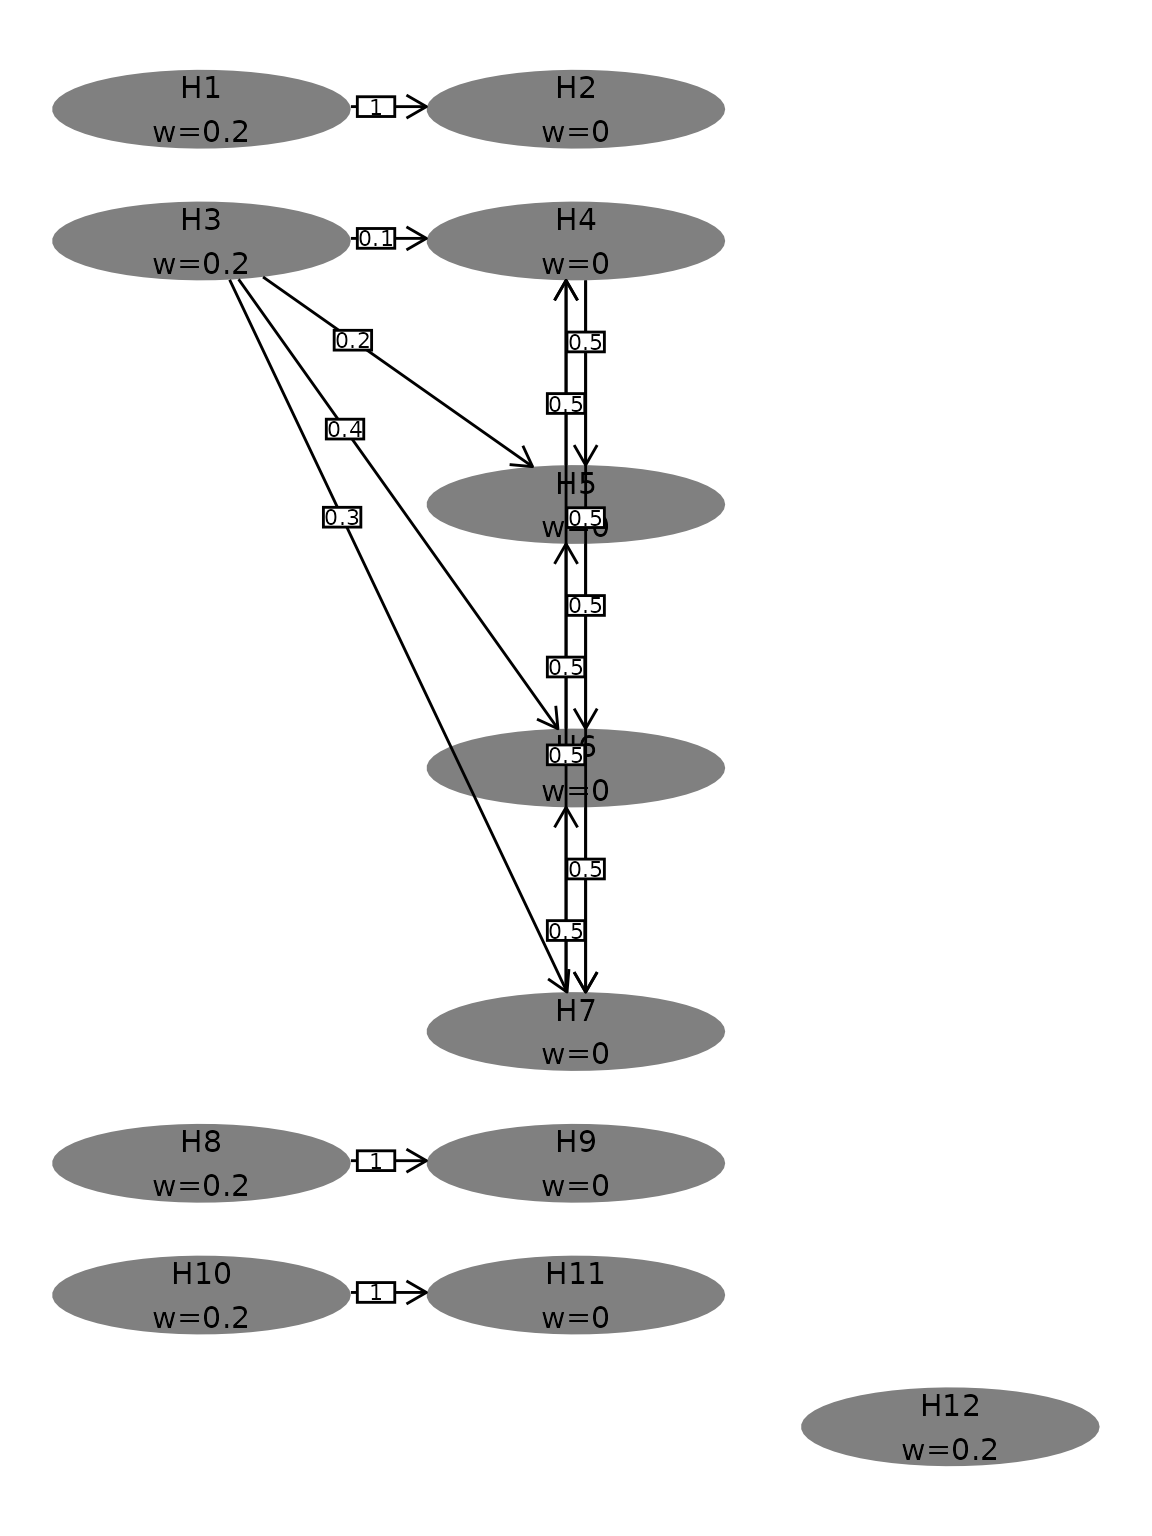
- A large graphical multiple testing procedure spanning 12 hypotheses across 5 endpoints.
Five families of hypotheses are evaluated in parallel within a single run. Hence, 5×α was used (with alpha initially distributed among the families). Each family allows alpha reallocation within its own set of hypotheses, but not across families. The total one-sided type I error rate of 12.5% is distributed across 5 families (each starting with its primary hypothesis) with an initial weight of 0.2.
Study Design
Two-Part Enrollment
The trial enrolls in two parts:
- Part 1 — TrtA vs Control (2:1 ratio), B+/B− stratified, over approximately 14 months.
- Part 2 — TrtAB arm opens. All three arms enroll (TrtA : Control : TrtAB = 1:1:4 ratio). B+/B− stratification continues.
The total accrual period is 22 months.
The Four-Stratum Structure
appendMCP uses a stratum field to
define subpopulations for enrollment and event modeling. This study uses
4 strata that encode two independent dimensions simultaneously:
| Stratum | Enrollment stage | Biomarker |
|---|---|---|
S1_Bpos |
Part 1 (before TrtAB opens) | B+ |
S1_Bneg |
Part 1 (before TrtAB opens) | B− |
S2_Bpos |
Part 2 (after TrtAB opens) | B+ |
S2_Bneg |
Part 2 (after TrtAB opens) | B− |
The S1/S2 dimension is introduced to track which patients were enrolled before vs after the TrtAB arm opened. The B+/B− dimension is a stratification factor that defines a subgroup of clinical interest (see H12).
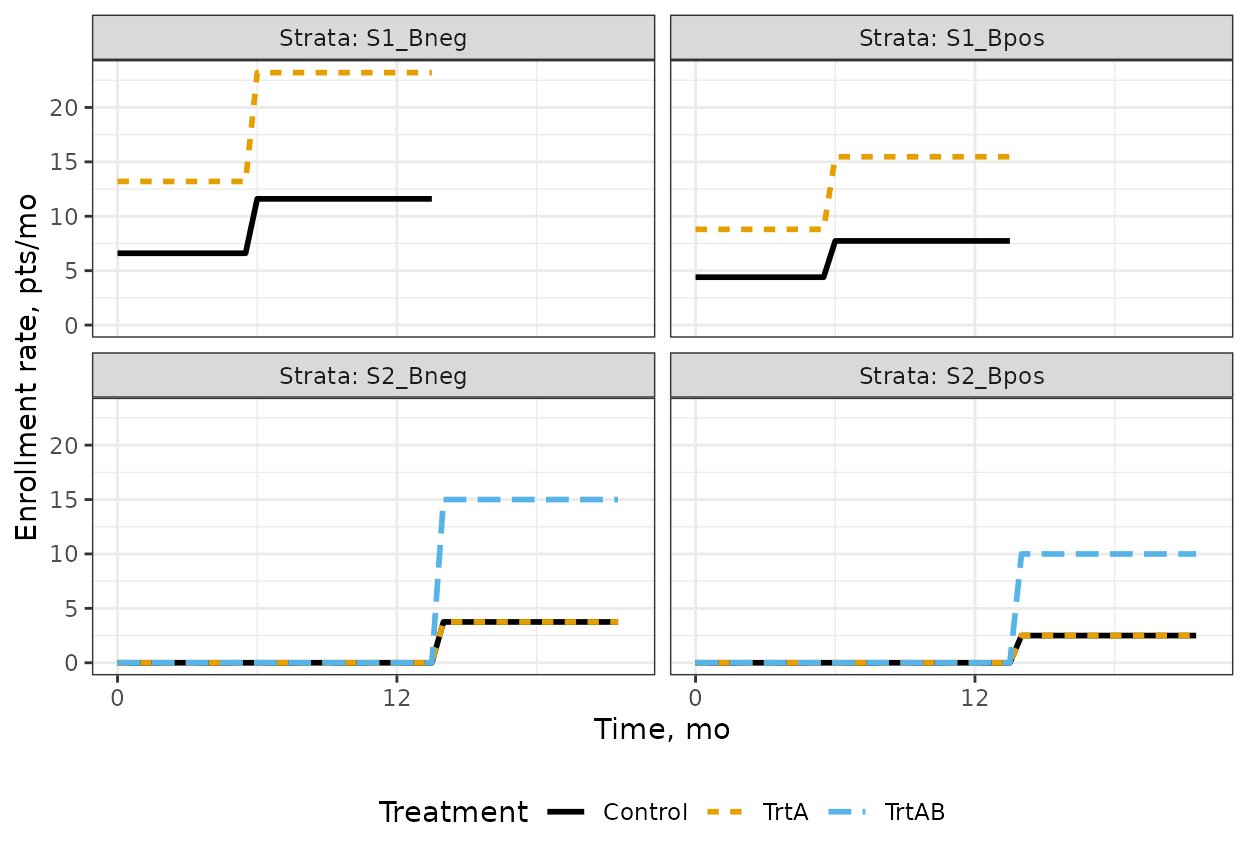
Encoding “Arm Added Midway” via Zero Enrollment Rates
The platform design is encoded in the enroll_rate table
using zero-rate placeholder rows. S2 strata have rate =
0 during Part 1 (months 0–14), signaling that no S2 patients exist yet.
S1 strata have no rows after Part 1, so their enrollment stops when Part
1 ends.
| stratum | treatments | rate | duration | ratio |
|---|---|---|---|---|
| S1_Bpos | TrtA , Control | 13.2 | 6 | 2, 1 |
| S1_Bneg | TrtA , Control | 19.8 | 6 | 2, 1 |
| S1_Bpos | TrtA , Control | 23.2 | 8 | 2, 1 |
| S1_Bneg | TrtA , Control | 34.8 | 8 | 2, 1 |
| S2_Bpos | TrtA , Control, TrtAB | 0.0 | 6 | 1, 1, 4 |
| S2_Bneg | TrtA , Control, TrtAB | 0.0 | 6 | 1, 1, 4 |
| S2_Bpos | TrtA , Control, TrtAB | 0.0 | 8 | 1, 1, 4 |
| S2_Bneg | TrtA , Control, TrtAB | 0.0 | 8 | 1, 1, 4 |
| S2_Bpos | TrtA , Control, TrtAB | 15.0 | 8 | 1, 1, 4 |
| S2_Bneg | TrtA , Control, TrtAB | 22.5 | 8 | 1, 1, 4 |
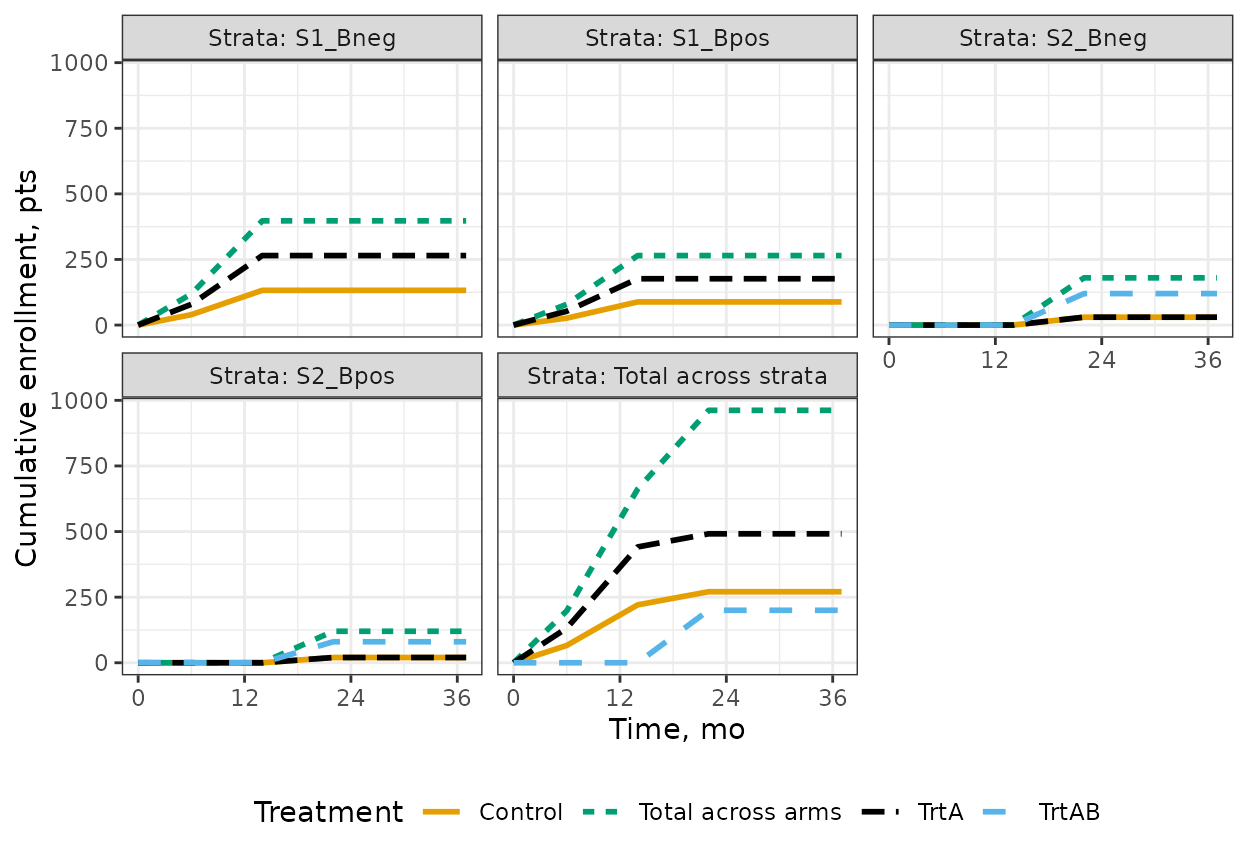
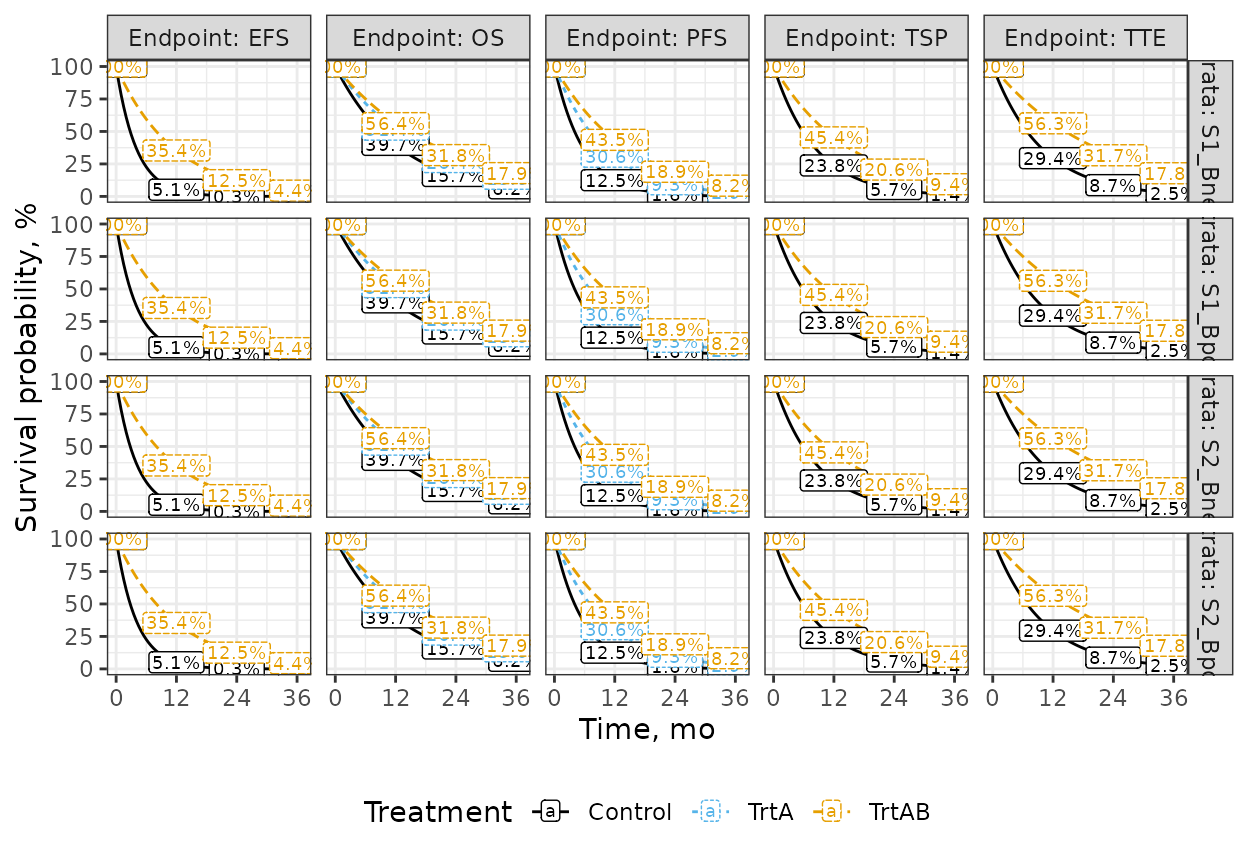
The enrollment curves below show the resulting piecewise accrual by arm and stage.
Multiplicity Adjustment
The multiplicity strategy follows the graphical approach of Maurer and Bretz (2013), controlling the family-wise type I error rate across both multiple hypotheses and multiple analyses.
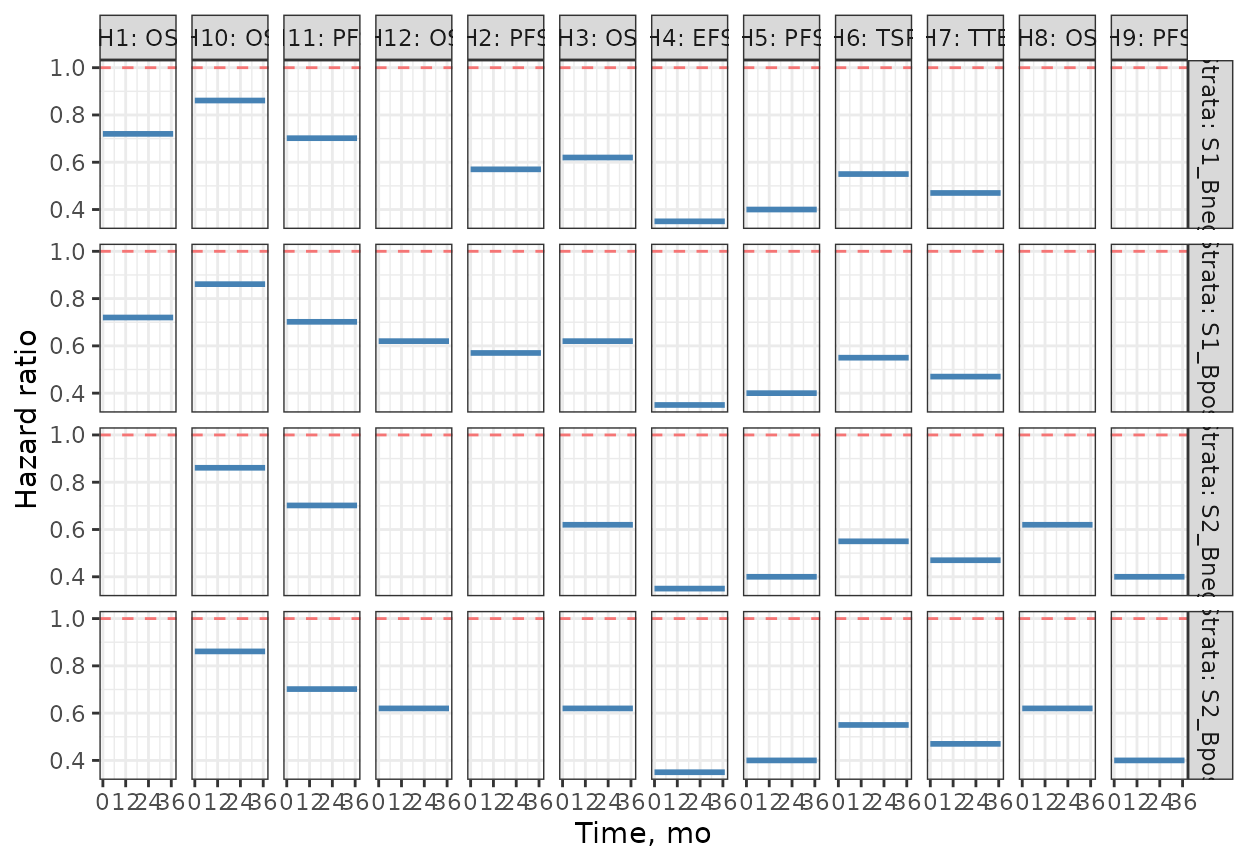
The 12 hypotheses span OS, PFS, EFS, TSP, TTE endpoints.
The following table provides a descriptive summary of each hypothesis for the reader’s convenience. (This table is specific to this vignette; in a formal report, abbreviated information could be captured in the Label column of Table 1.)
| Hypothesis | Endpoint | Comparison | Population | Family |
|---|---|---|---|---|
| H1 | OS | TrtA vs Control | S1 (Part 1 only) | 1 |
| H2 | PFS | TrtA vs Control | S1 (Part 1 only) | 1 |
| H3 | OS | TrtAB vs Control | S1+S2 (pooled) | 2 |
| H4 | EFS | TrtAB vs Control | S1+S2 (pooled) | 2 |
| H5 | PFS | TrtAB vs Control | S1+S2 (pooled) | 2 |
| H6 | TSP | TrtAB vs Control | S1+S2 (pooled) | 2 |
| H7 | TTE | TrtAB vs Control | S1+S2 (pooled) | 2 |
| H8 | OS | TrtAB vs Control | S2 (concurrent) | 3 |
| H9 | PFS | TrtAB vs Control | S2 (concurrent) | 3 |
| H10 | OS | TrtAB vs TrtA | S1+S2 (pooled) | 4 |
| H11 | PFS | TrtAB vs TrtA | S1+S2 (pooled) | 4 |
| H12 | OS | TrtAB vs Control | B+ subgroup only | 5 |
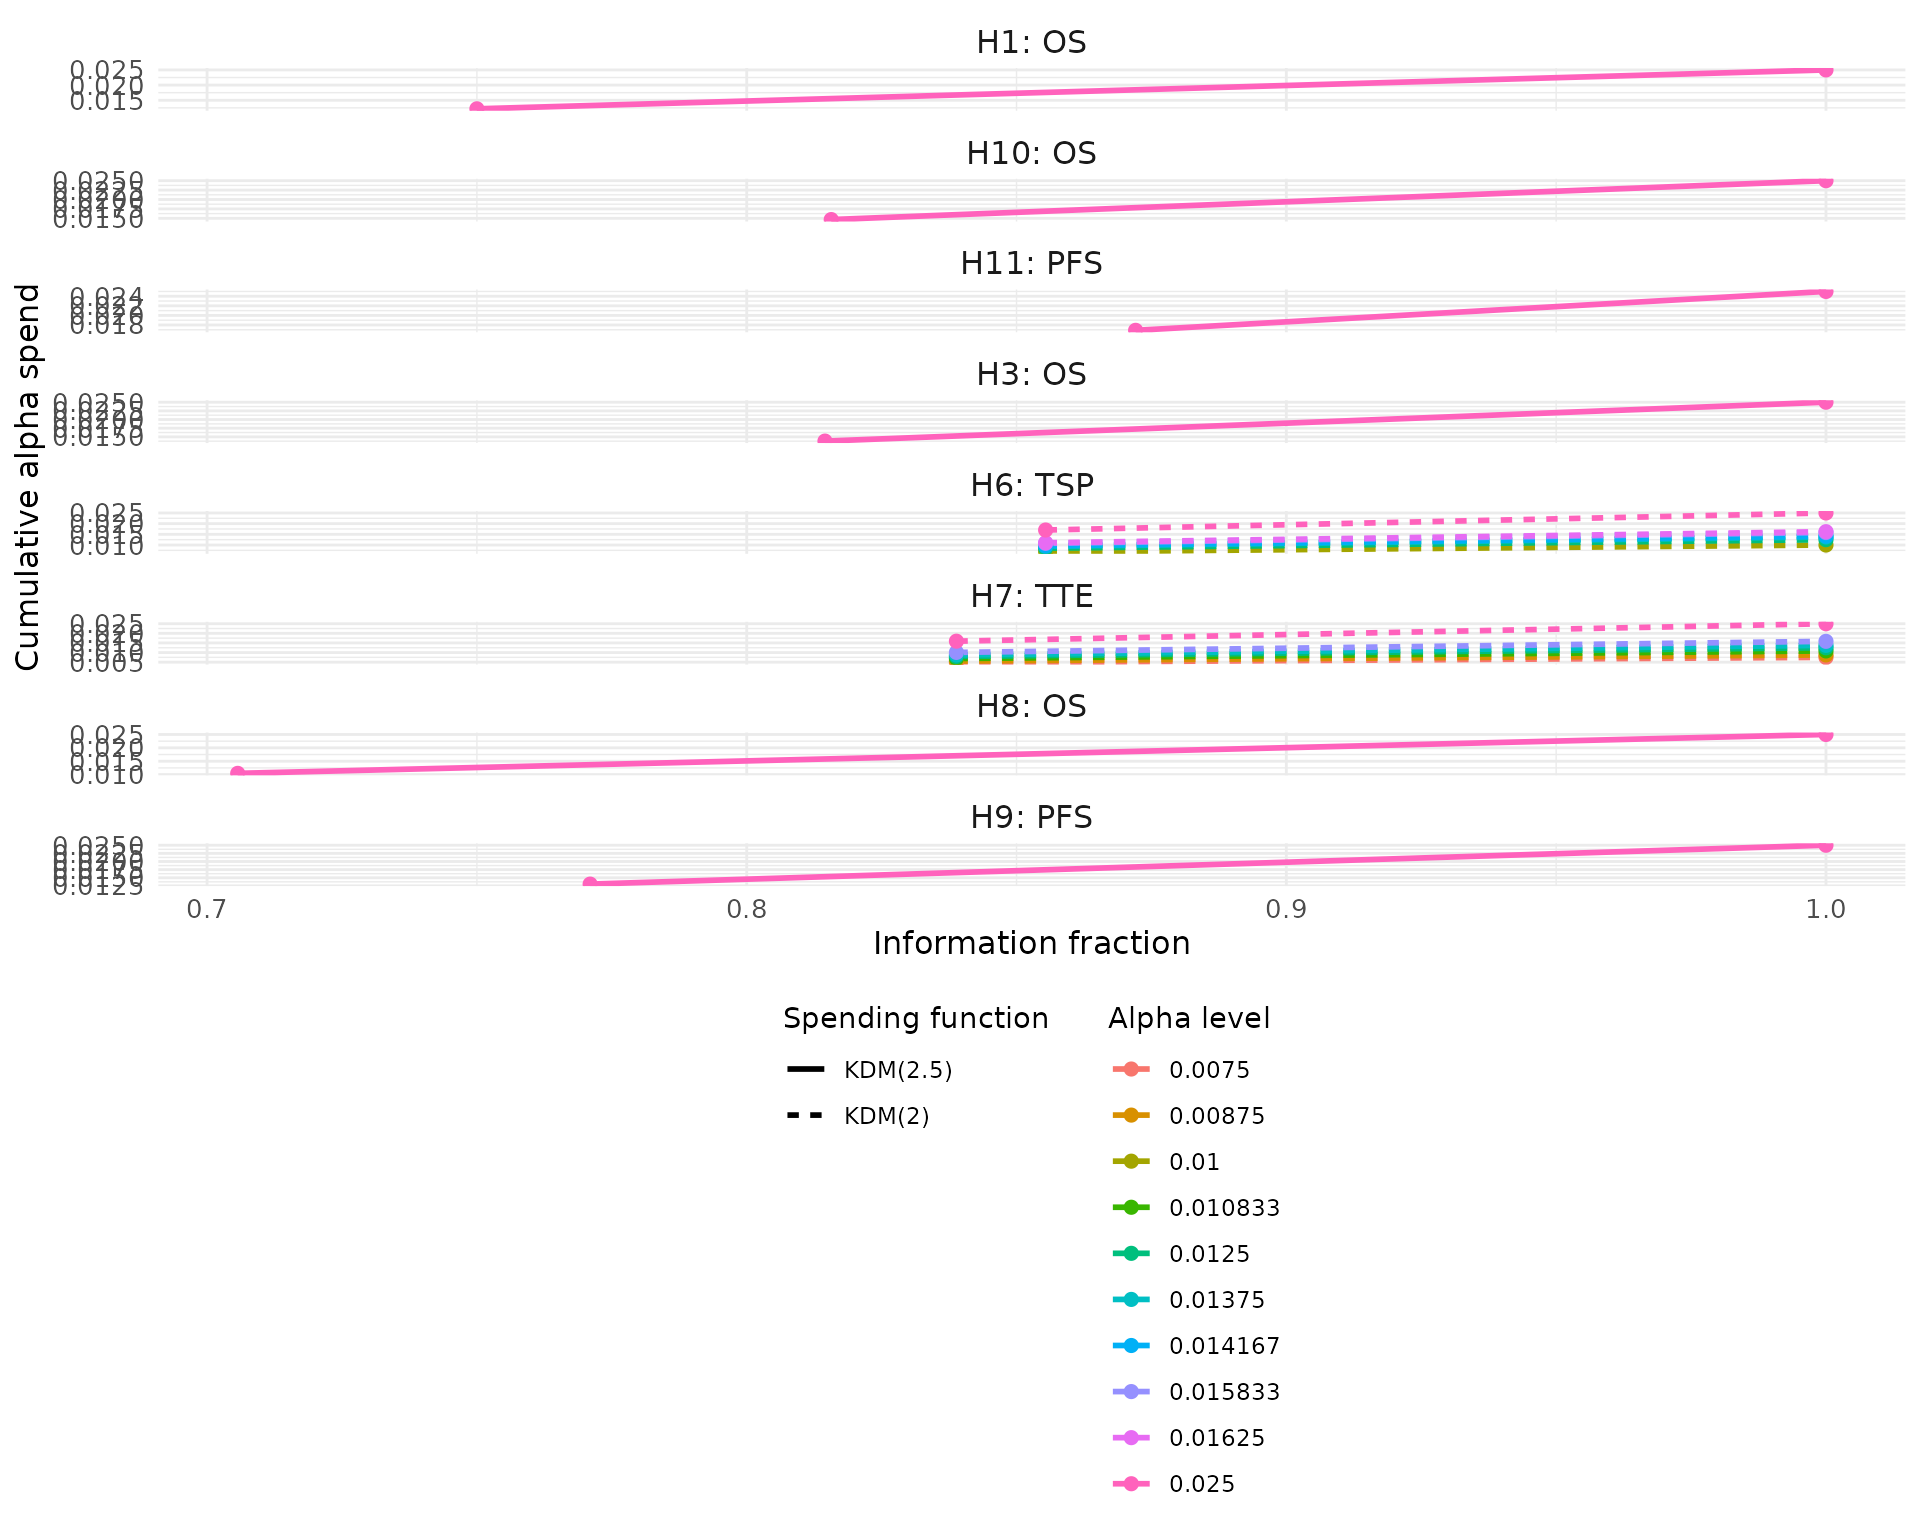
The following table summarizes the hypotheses with their alpha-spending functions and maximum statistical information.
Table 1. Summary of Hypotheses
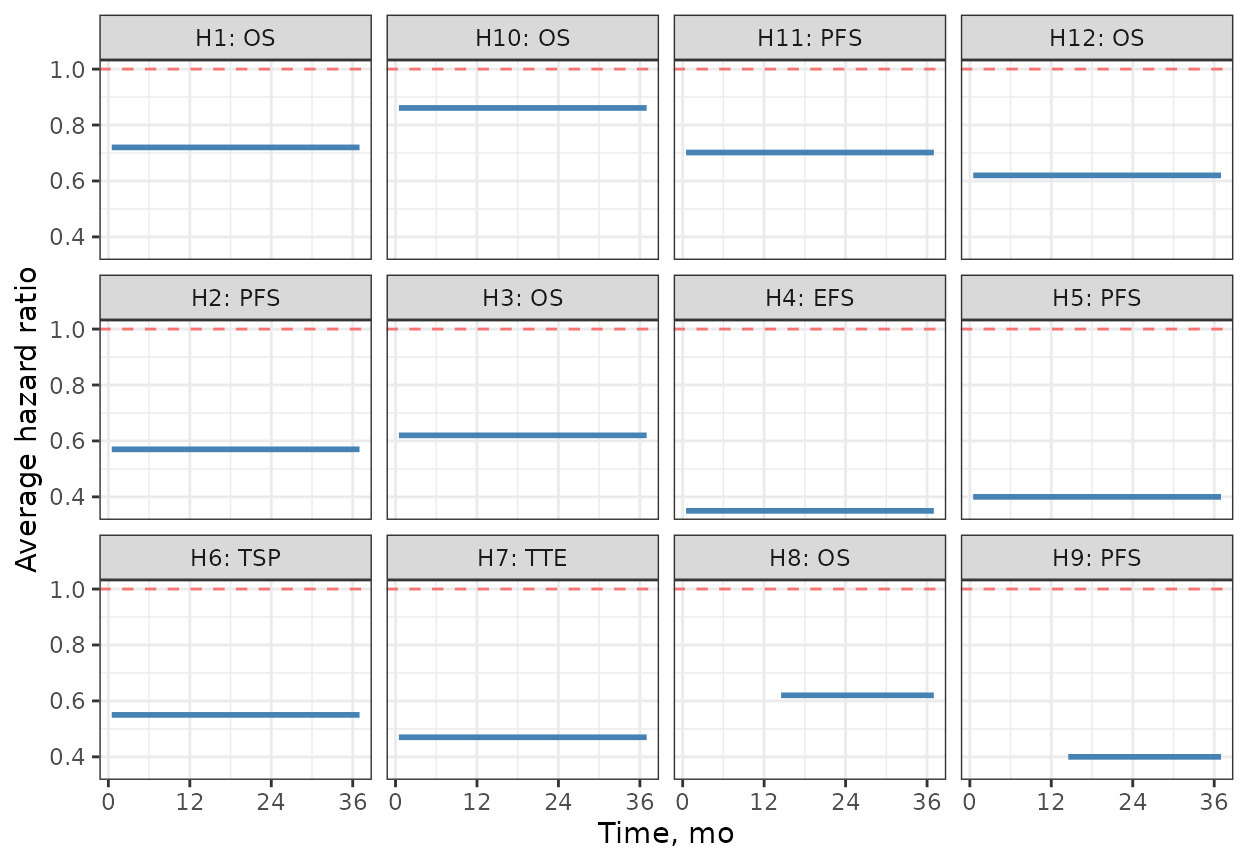
| Label | Endpoint | Type | Initial weight | GSD spending fn | Effect size* | Maximum events / sample size |
| H1 | OS | Primary | 0.2 | KDM(2.5) | HR = 0.72 | 444 |
| H2 | PFS | Secondary | 0 | N/A | HR = 0.57 | 475 |
| H3 | OS | Primary | 0.2 | KDM(2.5) | HR = 0.62 | 330 |
| H4 | EFS | Secondary | 0 | N/A | HR = 0.35 | 373 |
| H5 | PFS | Secondary | 0 | N/A | HR = 0.4 | 346 |
| H6 | TSP | Secondary | 0 | KDM(2) | HR = 0.55 | 377 |
| H7 | TTE | Secondary | 0 | KDM(2) | HR = 0.47 | 348 |
| H8 | OS | Primary | 0.2 | KDM(2.5) | HR = 0.62 | 148 |
| H9 | PFS | Secondary | 0 | KDM(2.5) | HR = 0.4 | 184 |
| H10 | OS | Primary | 0.2 | KDM(2.5) | HR = 0.861 | 465 |
| H11 | PFS | Secondary | 0 | KDM(2.5) | HR = 0.702 | 565 |
| H12 | OS | Primary | 0.2 | N/A | HR = 0.62 | 132 |
| *For a hypothesis corresponding to a time-to-event variable subject to non-proportional hazards, the listed effect size is the average hazard ratio at the final analysis of this hypothesis. | ||||||
Pooled vs Concurrent Control
For the TrtAB vs Control comparison, two separate sets of hypotheses are pre-specified:
- Pooled (H3–H7): Control arm patients from both Part 1 and Part 2 are combined. This maximizes power but assumes no stage effect on the control arm.
- Concurrent (H8–H9): Only control arm patients enrolled concurrently with TrtAB (Part 2, S2 strata) are used. This is conservative but robust to a potential stage effect.
Both strategies are included in the graphical testing procedure, with alpha propagating between them upon rejection.
Alpha Distribution
The overall family-wise type I error rate is controlled at 2.5%
(one-sided) per primary hypothesis. The alpha = 0.025 × 5
setting in the config reflects the five families evaluated in parallel.
Each family receives initial weight 0.2, giving it a significance level
of 0.025. Alpha can be reallocated within a family upon rejection, but
not across families.
Figure 1. Graphical Multiple Testing Procedure
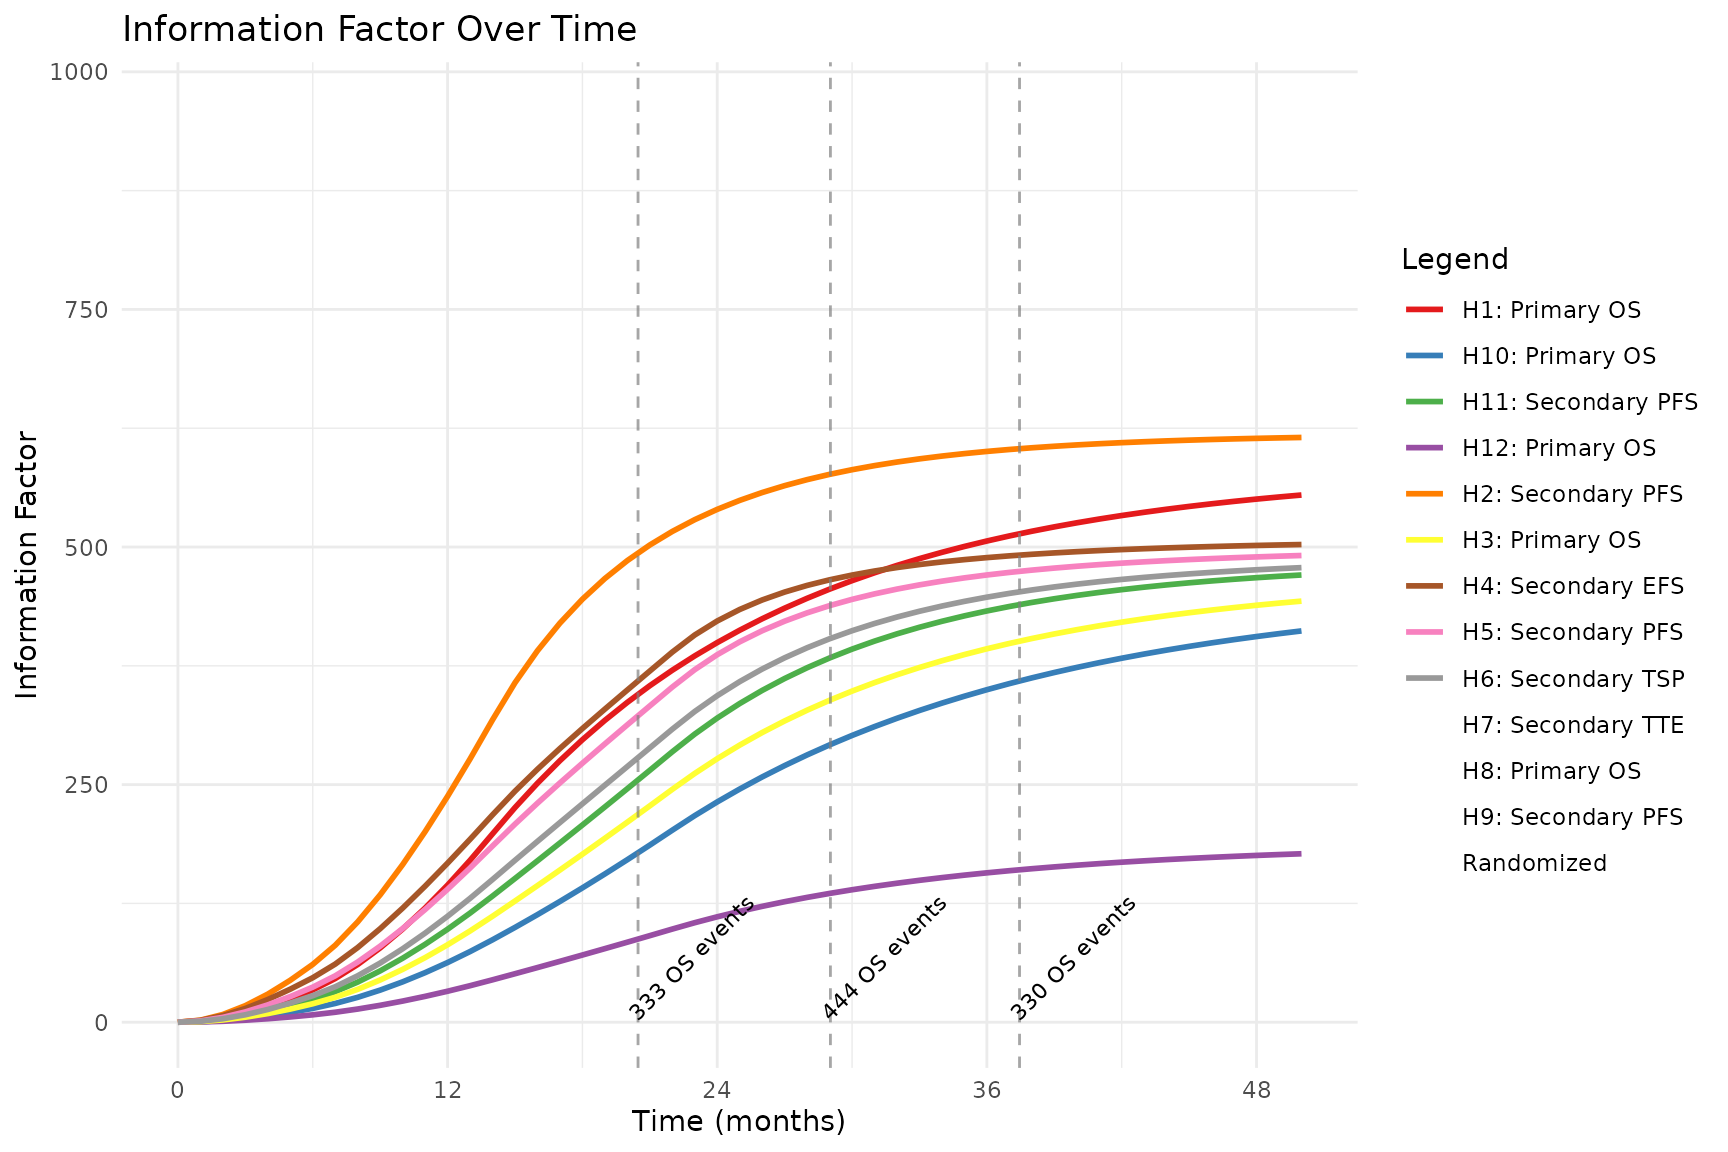
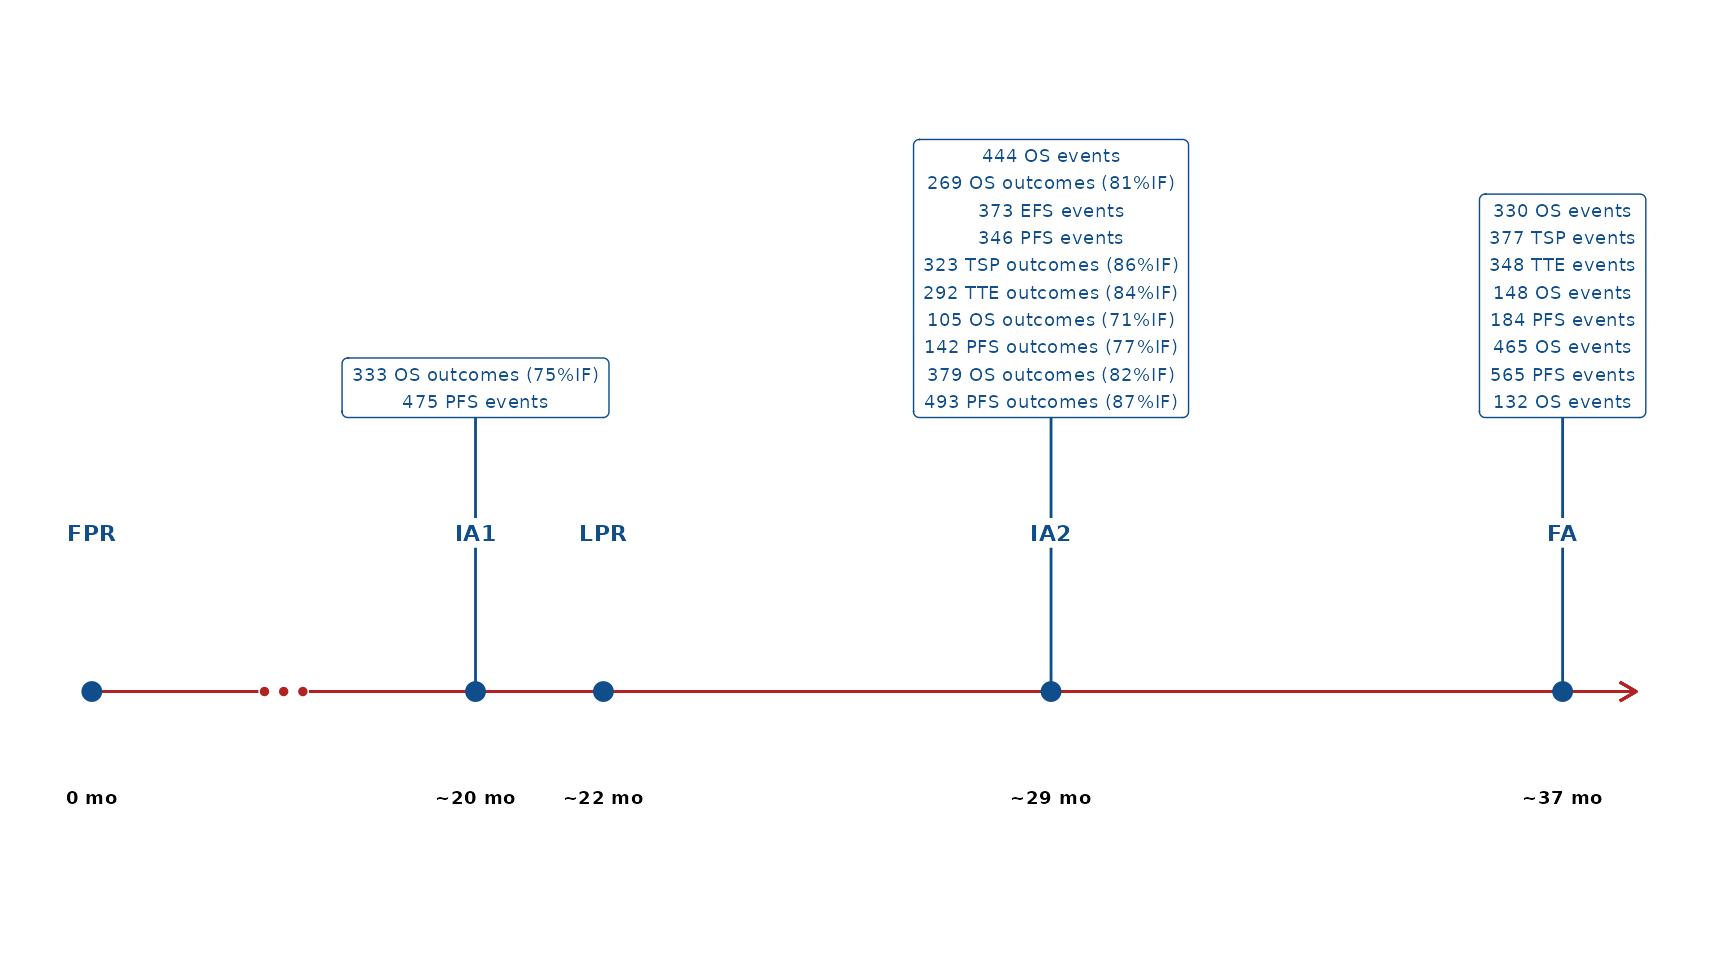
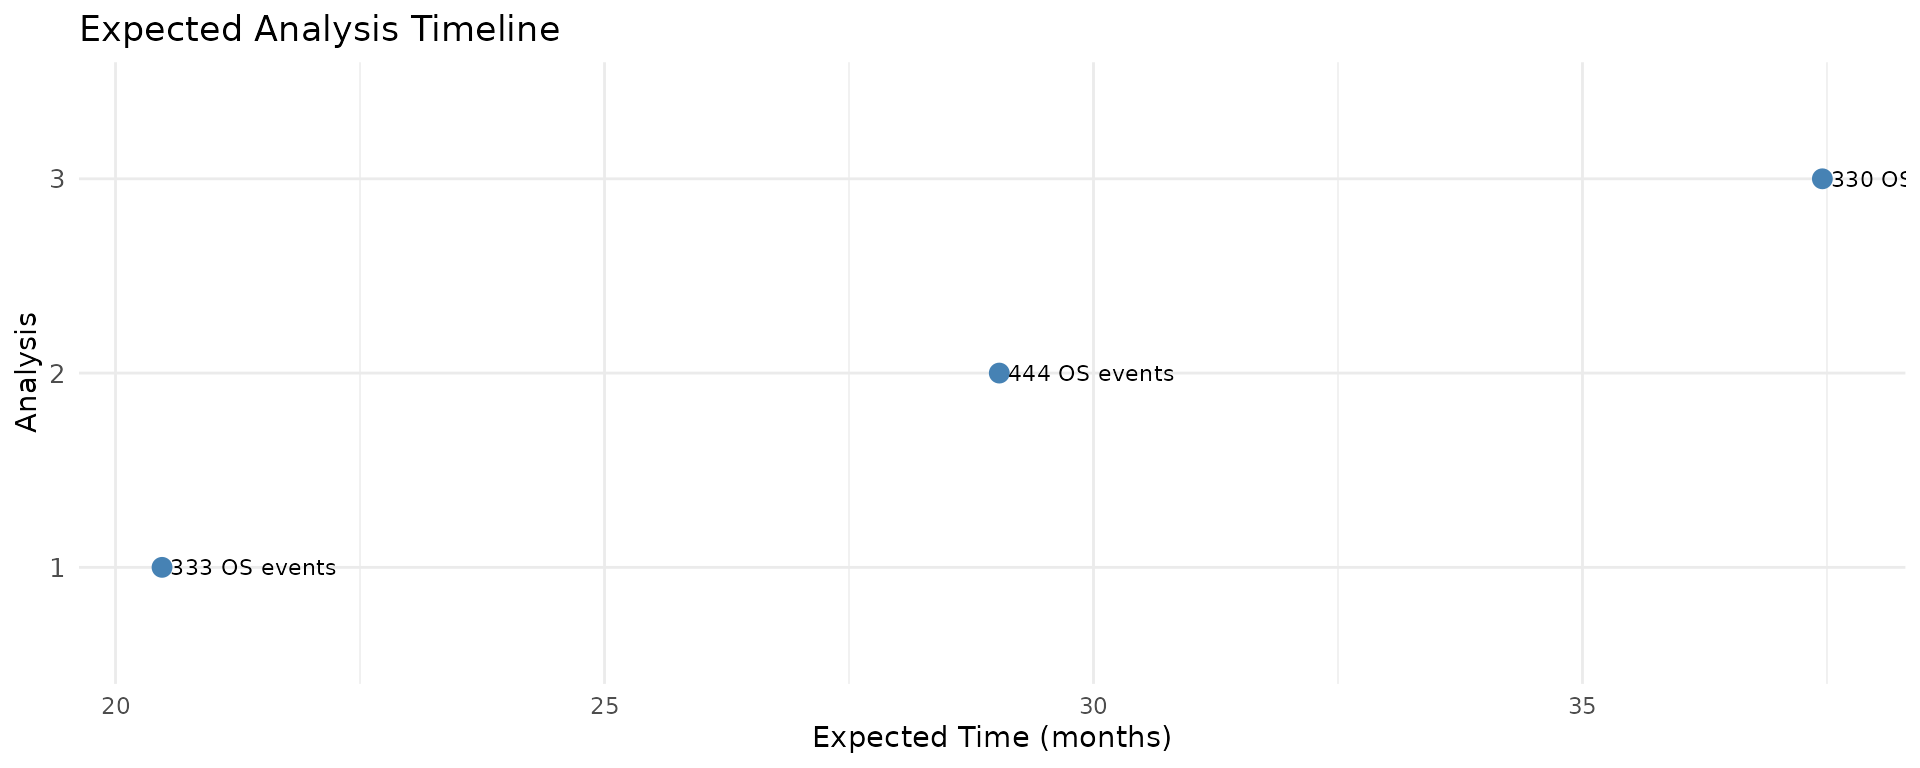
Interim Analyses
Three event-driven analyses are planned:
- IA1 — 333 OS events in S1 strata (TrtA vs Control)
- IA2 — 444 OS events in S1 strata (TrtA vs Control, final for Part 1) and first look at TrtAB vs Control
- FA — 330 OS events in S1+S2 strata (TrtAB vs Control, final)
Table 2. Summary of Interim Analyses (by hypothesis)
| Analysis | Criteria for conduct | Events / sample size | Expected analysis time, mo | Information fraction, % |
| H1: OS | ||||
| 1 | 333 OS events | 333 | 20.5 | 75.0% |
| 2 | 444 OS events | 444 | 29.0 | 100.0% |
| H2: PFS | ||||
| 1 | 333 OS events | 475 | 20.5 | 100.0% |
| H3: OS | ||||
| 2 | 444 OS events | 269 | 29.0 | 81.5% |
| 3 | 330 OS events | 330 | 37.5 | 100.0% |
| H4: EFS | ||||
| 2 | 444 OS events | 373 | 29.0 | 100.0% |
| H5: PFS | ||||
| 2 | 444 OS events | 346 | 29.0 | 100.0% |
| H6: TSP | ||||
| 2 | 444 OS events | 323 | 29.0 | 85.5% |
| 3 | 330 OS events | 377 | 37.5 | 100.0% |
| H7: TTE | ||||
| 2 | 444 OS events | 292 | 29.0 | 83.9% |
| 3 | 330 OS events | 348 | 37.5 | 100.0% |
| H8: OS | ||||
| 2 | 444 OS events | 105 | 29.0 | 70.6% |
| 3 | 330 OS events | 148 | 37.5 | 100.0% |
| H9: PFS | ||||
| 2 | 444 OS events | 142 | 29.0 | 77.1% |
| 3 | 330 OS events | 184 | 37.5 | 100.0% |
| H10: OS | ||||
| 2 | 444 OS events | 379 | 29.0 | 81.6% |
| 3 | 330 OS events | 465 | 37.5 | 100.0% |
| H11: PFS | ||||
| 2 | 444 OS events | 493 | 29.0 | 87.2% |
| 3 | 330 OS events | 565 | 37.5 | 100.0% |
| H12: OS | ||||
| 3 | 330 OS events | 132 | 37.5 | 100.0% |
Table 3. Summary of Interim Analyses (by calendar analysis)
| Hypothesis | Analysis | Events / sample size | Information fraction, % |
| 333 OS events (Expected analysis time: 20.5 mo) | |||
| H1: OS | 1 | 333 | 75.0% |
| H2: PFS | 1 | 475 | 100.0% |
| 444 OS events (Expected analysis time: 29.0 mo) | |||
| H1: OS | 2 | 444 | 100.0% |
| H3: OS | 2 | 269 | 81.5% |
| H4: EFS | 2 | 373 | 100.0% |
| H5: PFS | 2 | 346 | 100.0% |
| H6: TSP | 2 | 323 | 85.5% |
| H7: TTE | 2 | 292 | 83.9% |
| H8: OS | 2 | 105 | 70.6% |
| H9: PFS | 2 | 142 | 77.1% |
| H10: OS | 2 | 379 | 81.6% |
| H11: PFS | 2 | 493 | 87.2% |
| 330 OS events (Expected analysis time: 37.5 mo) | |||
| H3: OS | 3 | 330 | 100.0% |
| H6: TSP | 3 | 377 | 100.0% |
| H7: TTE | 3 | 348 | 100.0% |
| H8: OS | 3 | 148 | 100.0% |
| H9: PFS | 3 | 184 | 100.0% |
| H10: OS | 3 | 465 | 100.0% |
| H11: PFS | 3 | 565 | 100.0% |
| H12: OS | 3 | 132 | 100.0% |
Hypothesis Testing
Table 4. Weight Allocation Scenarios
| Local alpha level | Weight | Testing scenario |
| H1: OS | ||
| 0.02500 | 0.2 | Initial allocation |
| H2: PFS | ||
| 0.02500 | 0.2 | Successful H1 |
| H3: OS | ||
| 0.02500 | 0.2 | Initial allocation |
| H4: EFS | ||
| 0.00250 | 0.02 | Successful H3 |
| 0.00500 | 0.04 | Successful H3, H5 |
| 0.00625 | 0.05 | Successful H3, H7 |
| 0.00875 | 0.07 | Successful H3, H5, H7 |
| 0.00917 | 0.0733 | Successful H3, H5, H6 |
| 0.01083 | 0.0867 | Successful H3, H6, H7 |
| 0.02500 | 0.2 | Successful H3, H5, H6, H7 |
| H5: PFS | ||
| 0.00500 | 0.04 | Successful H3 |
| 0.00625 | 0.05 | Successful H3, H4 |
| 0.00917 | 0.0733 | Successful H3, H4, H7 |
| 0.01000 | 0.08 | Successful H3, H6 |
| 0.01125 | 0.09 | Successful H3, H4, H6 |
| 0.01417 | 0.113 | Successful H3, H6, H7 |
| 0.02500 | 0.2 | Successful H3, H4, H6, H7 |
| H6: TSP | ||
| 0.01000 | 0.08 | Successful H3 |
| 0.01250 | 0.1 | Successful H3, H5 |
| 0.01375 | 0.11 | Successful H3, H7 |
| 0.01417 | 0.113 | Successful H3, H4, H5 |
| 0.01583 | 0.127 | Successful H3, H4, H7 |
| 0.01625 | 0.13 | Successful H3, H5, H7 |
| 0.02500 | 0.2 | Successful H3, H4, H5, H7 |
| H7: TTE | ||
| 0.00750 | 0.06 | Successful H3 |
| 0.00875 | 0.07 | Successful H3, H4 |
| 0.01083 | 0.0867 | Successful H3, H4, H5 |
| 0.01250 | 0.1 | Successful H3, H6 |
| 0.01375 | 0.11 | Successful H3, H4, H6 |
| 0.01583 | 0.127 | Successful H3, H5, H6 |
| 0.02500 | 0.2 | Successful H3, H4, H5, H6 |
| H8: OS | ||
| 0.02500 | 0.2 | Initial allocation |
| H9: PFS | ||
| 0.02500 | 0.2 | Successful H8 |
| H10: OS | ||
| 0.02500 | 0.2 | Initial allocation |
| H11: PFS | ||
| 0.02500 | 0.2 | Successful H10 |
| H12: OS | ||
| 0.02500 | 0.2 | Initial allocation |
Table 5. Boundary Specifications
| Analysis | Local alpha level | Nominal p-value | Exit hurdle | Local power | Information fraction, % |
| H1: OS | |||||
| 1 | 0.02500 | 0.01218 | 0.770 | 72.3% | 75.0% |
| 2 | 0.02500 | 0.02055 | 0.814 | 88.7% | 100.0% |
| H2: PFS | |||||
| 1 | 0.02500 | 0.02500 | 0.826 | 100.0% | 100.0% |
| H3: OS | |||||
| 1 | 0.02500 | 0.01378 | 0.701 | 79.5% | 81.5% |
| 2 | 0.02500 | 0.02015 | 0.746 | 89.2% | 100.0% |
| H4: EFS | |||||
| 1 | 0.00250 | 0.00250 | 0.684 | 100.0% | 100.0% |
| 1 | 0.00500 | 0.00500 | 0.706 | 100.0% | 100.0% |
| 1 | 0.00625 | 0.00625 | 0.713 | 100.0% | 100.0% |
| 1 | 0.00875 | 0.00875 | 0.725 | 100.0% | 100.0% |
| 1 | 0.00917 | 0.00917 | 0.727 | 100.0% | 100.0% |
| 1 | 0.01083 | 0.01083 | 0.733 | 100.0% | 100.0% |
| 1 | 0.02500 | 0.02500 | 0.767 | 100.0% | 100.0% |
| H5: PFS | |||||
| 1 | 0.00500 | 0.00500 | 0.693 | 100.0% | 100.0% |
| 1 | 0.00625 | 0.00625 | 0.701 | 100.0% | 100.0% |
| 1 | 0.00917 | 0.00917 | 0.715 | 100.0% | 100.0% |
| 1 | 0.01000 | 0.01000 | 0.718 | 100.0% | 100.0% |
| 1 | 0.01125 | 0.01125 | 0.723 | 100.0% | 100.0% |
| 1 | 0.01417 | 0.01417 | 0.732 | 100.0% | 100.0% |
| 1 | 0.02500 | 0.02500 | 0.756 | 100.0% | 100.0% |
| H6: TSP | |||||
| 1 | 0.01000 | 0.00681 | 0.697 | 96.0% | 85.5% |
| 2 | 0.01000 | 0.00691 | 0.721 | 97.6% | 100.0% |
| 1 | 0.01250 | 0.00851 | 0.706 | 96.7% | 85.5% |
| 2 | 0.01250 | 0.00876 | 0.730 | 98.1% | 100.0% |
| 1 | 0.01375 | 0.00936 | 0.709 | 97.0% | 85.5% |
| 2 | 0.01375 | 0.00970 | 0.733 | 98.3% | 100.0% |
| 1 | 0.01417 | 0.00964 | 0.710 | 97.1% | 85.5% |
| 2 | 0.01417 | 0.01002 | 0.734 | 98.3% | 100.0% |
| 1 | 0.01583 | 0.01078 | 0.715 | 97.4% | 85.5% |
| 2 | 0.01583 | 0.01128 | 0.739 | 98.5% | 100.0% |
| 1 | 0.01625 | 0.01106 | 0.716 | 97.4% | 85.5% |
| 2 | 0.01625 | 0.01160 | 0.740 | 98.5% | 100.0% |
| 1 | 0.02500 | 0.01701 | 0.734 | 98.3% | 85.5% |
| 2 | 0.02500 | 0.01842 | 0.758 | 99.1% | 100.0% |
| H7: TTE | |||||
| 1 | 0.00750 | 0.00477 | 0.663 | 99.2% | 83.9% |
| 2 | 0.00750 | 0.00517 | 0.696 | 99.5% | 100.0% |
| 1 | 0.00875 | 0.00557 | 0.669 | 99.4% | 83.9% |
| 2 | 0.00875 | 0.00609 | 0.702 | 99.6% | 100.0% |
| 1 | 0.01083 | 0.00690 | 0.677 | 99.5% | 83.9% |
| 2 | 0.01083 | 0.00765 | 0.710 | 99.7% | 100.0% |
| 1 | 0.01250 | 0.00796 | 0.683 | 99.6% | 83.9% |
| 2 | 0.01250 | 0.00891 | 0.715 | 99.7% | 100.0% |
| 1 | 0.01375 | 0.00875 | 0.686 | 99.6% | 83.9% |
| 2 | 0.01375 | 0.00986 | 0.719 | 99.8% | 100.0% |
| 1 | 0.01583 | 0.01008 | 0.692 | 99.7% | 83.9% |
| 2 | 0.01583 | 0.01146 | 0.725 | 99.8% | 100.0% |
| 1 | 0.02500 | 0.01591 | 0.712 | 99.8% | 83.9% |
| 2 | 0.02500 | 0.01867 | 0.745 | 99.9% | 100.0% |
| H8: OS | |||||
| 1 | 0.02500 | 0.01046 | 0.569 | 35.0% | 70.6% |
| 2 | 0.02500 | 0.02103 | 0.659 | 60.9% | 100.0% |
| H9: PFS | |||||
| 1 | 0.02500 | 0.01305 | 0.627 | 99.2% | 77.1% |
| 2 | 0.02500 | 0.02033 | 0.686 | 99.5% | 100.0% |
| H10: OS | |||||
| 1 | 0.02500 | 0.01466 | 0.785 | 20.0% | 81.6% |
| 2 | 0.02500 | 0.01993 | 0.815 | 31.0% | 100.0% |
| H11: PFS | |||||
| 1 | 0.02500 | 0.01688 | 0.812 | 93.5% | 87.2% |
| 2 | 0.02500 | 0.01944 | 0.829 | 96.8% | 100.0% |
| H12: OS | |||||
| 1 | 0.02500 | 0.02500 | 0.642 | 56.5% | 100.0% |
Operating Characteristics
Table 6a. Operating Characteristics at Each Analysis
| Analysis | Metric | Hypothesis subset | Probability, % |
| 1 | Power | H1 | 74.6% |
| H2 | 74.6% | ||
| H3 | 0.0% | ||
| H4 | 0.0% | ||
| H5 | 0.0% | ||
| H6 | 0.0% | ||
| H7 | 0.0% | ||
| H8 | 0.0% | ||
| H9 | 0.0% | ||
| H10 | 0.0% | ||
| H11 | 0.0% | ||
| H12 | 0.0% | ||
| 2 | H1 | 91.5% | |
| H2 | 91.5% | ||
| H3 | 91.3% | ||
| H4 | 91.3% | ||
| H5 | 91.3% | ||
| H6 | 90.9% | ||
| H7 | 91.3% | ||
| H8 | 65.2% | ||
| H9 | 65.1% | ||
| H10 | 25.8% | ||
| H11 | 24.7% | ||
| H12 | 0.0% | ||
| 3 | H1 | 91.5% | |
| H2 | 91.5% | ||
| H3 | 95.0% | ||
| H4 | 95.0% | ||
| H5 | 95.0% | ||
| H6 | 94.9% | ||
| H7 | 95.0% | ||
| H8 | 75.4% | ||
| H9 | 75.3% | ||
| H10 | 33.3% | ||
| H11 | 32.4% | ||
| H12 | 60.5% |
Table 6b. Operating Characteristics Across Analyses
| Metric | Hypothesis subset | Value |
| Expected Success Analysis | H1 | 1.18 |
| H2 | 1.18 | |
| H3 | 2.04 | |
| H4 | 2.04 | |
| H5 | 2.04 | |
| H6 | 2.04 | |
| H7 | 2.04 | |
| H8 | 2.14 | |
| H9 | 2.14 | |
| H10 | 2.22 | |
| H11 | 2.24 | |
| H12 | 3.00 | |
| Expected Success Time | H1 | 22.1 |
| H2 | 22.1 | |
| H3 | 29.4 | |
| H4 | 29.4 | |
| H5 | 29.4 | |
| H6 | 29.4 | |
| H7 | 29.4 | |
| H8 | 30.2 | |
| H9 | 30.2 | |
| H10 | 30.9 | |
| H11 | 31.0 | |
| H12 | 37.5 |
Input Data
| stratum | treatments | rate | duration | ratio |
|---|---|---|---|---|
| S1_Bpos | TrtA , Control | 13.2 | 6 | 2, 1 |
| S1_Bneg | TrtA , Control | 19.8 | 6 | 2, 1 |
| S1_Bpos | TrtA , Control | 23.2 | 8 | 2, 1 |
| S1_Bneg | TrtA , Control | 34.8 | 8 | 2, 1 |
| S2_Bpos | TrtA , Control, TrtAB | 0.0 | 6 | 1, 1, 4 |
| S2_Bneg | TrtA , Control, TrtAB | 0.0 | 6 | 1, 1, 4 |
| S2_Bpos | TrtA , Control, TrtAB | 0.0 | 8 | 1, 1, 4 |
| S2_Bneg | TrtA , Control, TrtAB | 0.0 | 8 | 1, 1, 4 |
| S2_Bpos | TrtA , Control, TrtAB | 15.0 | 8 | 1, 1, 4 |
| S2_Bneg | TrtA , Control, TrtAB | 22.5 | 8 | 1, 1, 4 |
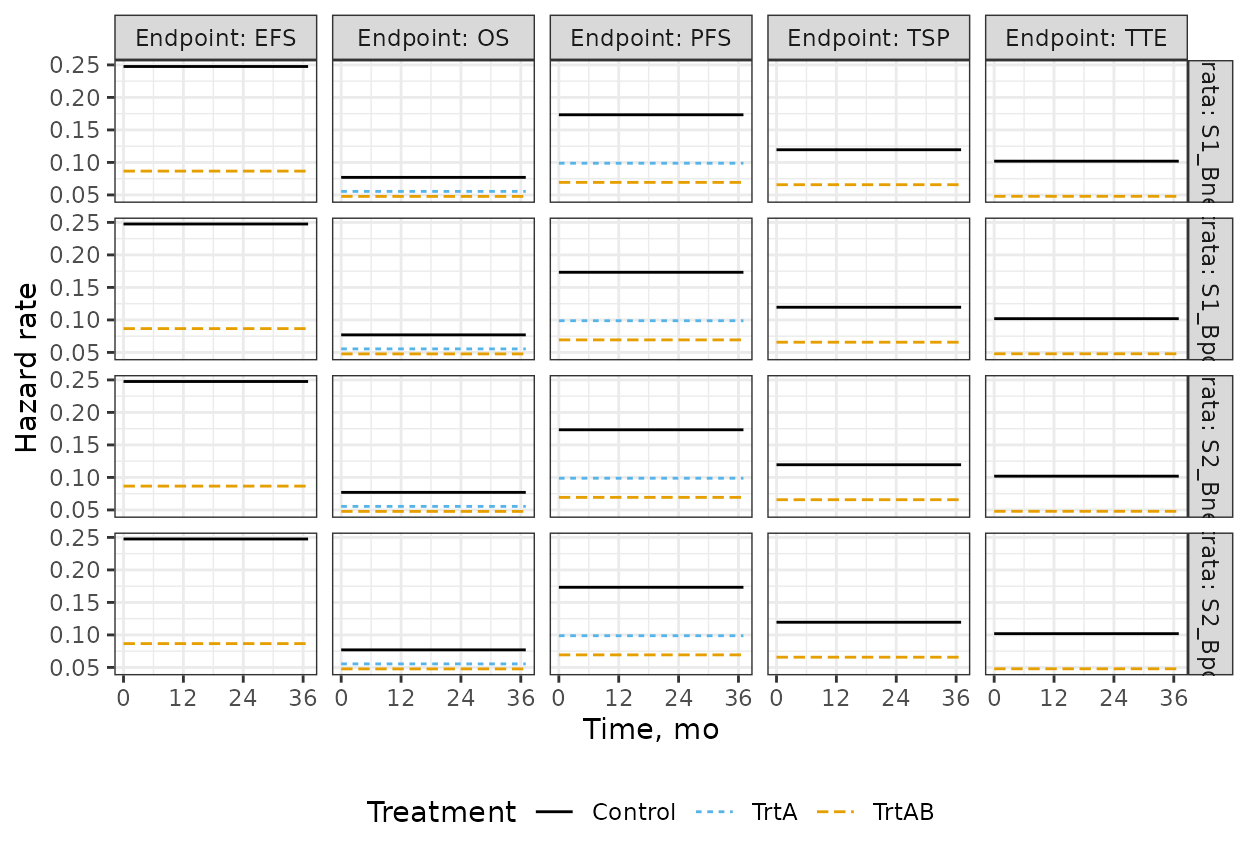
| endpoint | stratum | treatment | duration | fail_rate | dropout_rate |
|---|---|---|---|---|---|
| OS | S1_Bpos | TrtA | Inf | 0.0555 | 0.0088 |
| OS | S1_Bpos | Control | Inf | 0.0770 | 0.0088 |
| OS | S1_Bneg | TrtA | Inf | 0.0555 | 0.0088 |
| OS | S1_Bneg | Control | Inf | 0.0770 | 0.0088 |
| OS | S2_Bpos | TrtA | Inf | 0.0555 | 0.0088 |
| OS | S2_Bpos | Control | Inf | 0.0770 | 0.0088 |
| OS | S2_Bneg | TrtA | Inf | 0.0555 | 0.0088 |
| OS | S2_Bneg | Control | Inf | 0.0770 | 0.0088 |
| OS | S1_Bpos | TrtAB | Inf | 0.0478 | 0.0088 |
| OS | S1_Bneg | TrtAB | Inf | 0.0478 | 0.0088 |
| OS | S2_Bpos | TrtAB | Inf | 0.0478 | 0.0088 |
| OS | S2_Bneg | TrtAB | Inf | 0.0478 | 0.0088 |
| PFS | S1_Bpos | TrtA | Inf | 0.0988 | 0.0088 |
| PFS | S1_Bpos | Control | Inf | 0.1733 | 0.0088 |
| PFS | S1_Bneg | TrtA | Inf | 0.0988 | 0.0088 |
| PFS | S1_Bneg | Control | Inf | 0.1733 | 0.0088 |
| PFS | S2_Bpos | TrtA | Inf | 0.0988 | 0.0088 |
| PFS | S2_Bpos | Control | Inf | 0.1733 | 0.0088 |
| PFS | S2_Bneg | TrtA | Inf | 0.0988 | 0.0088 |
| PFS | S2_Bneg | Control | Inf | 0.1733 | 0.0088 |
| PFS | S1_Bpos | TrtAB | Inf | 0.0693 | 0.0088 |
| PFS | S1_Bneg | TrtAB | Inf | 0.0693 | 0.0088 |
| PFS | S2_Bpos | TrtAB | Inf | 0.0693 | 0.0088 |
| PFS | S2_Bneg | TrtAB | Inf | 0.0693 | 0.0088 |
| EFS | S1_Bpos | TrtAB | Inf | 0.0866 | 0.0088 |
| EFS | S1_Bneg | TrtAB | Inf | 0.0866 | 0.0088 |
| EFS | S2_Bpos | TrtAB | Inf | 0.0866 | 0.0088 |
| EFS | S2_Bneg | TrtAB | Inf | 0.0866 | 0.0088 |
| EFS | S1_Bpos | Control | Inf | 0.2476 | 0.0088 |
| EFS | S1_Bneg | Control | Inf | 0.2476 | 0.0088 |
| EFS | S2_Bpos | Control | Inf | 0.2476 | 0.0088 |
| EFS | S2_Bneg | Control | Inf | 0.2476 | 0.0088 |
| TSP | S1_Bpos | TrtAB | Inf | 0.0657 | 0.0088 |
| TSP | S1_Bneg | TrtAB | Inf | 0.0657 | 0.0088 |
| TSP | S2_Bpos | TrtAB | Inf | 0.0657 | 0.0088 |
| TSP | S2_Bneg | TrtAB | Inf | 0.0657 | 0.0088 |
| TSP | S1_Bpos | Control | Inf | 0.1195 | 0.0088 |
| TSP | S1_Bneg | Control | Inf | 0.1195 | 0.0088 |
| TSP | S2_Bpos | Control | Inf | 0.1195 | 0.0088 |
| TSP | S2_Bneg | Control | Inf | 0.1195 | 0.0088 |
| TTE | S1_Bpos | TrtAB | Inf | 0.0479 | 0.0088 |
| TTE | S1_Bneg | TrtAB | Inf | 0.0479 | 0.0088 |
| TTE | S2_Bpos | TrtAB | Inf | 0.0479 | 0.0088 |
| TTE | S2_Bneg | TrtAB | Inf | 0.0479 | 0.0088 |
| TTE | S1_Bpos | Control | Inf | 0.1019 | 0.0088 |
| TTE | S1_Bneg | Control | Inf | 0.1019 | 0.0088 |
| TTE | S2_Bpos | Control | Inf | 0.1019 | 0.0088 |
| TTE | S2_Bneg | Control | Inf | 0.1019 | 0.0088 |
Initial weights: 0.2, 0, 0.2, 0, 0, 0, 0, 0.2, 0, 0.2, 0, 0.2
| 0 | 1 | 0 | 0.0 | 0.0 | 0.0 | 0.0 | 0 | 0 | 0 | 0 | 0 |
| 0 | 0 | 0 | 0.0 | 0.0 | 0.0 | 0.0 | 0 | 0 | 0 | 0 | 0 |
| 0 | 0 | 0 | 0.1 | 0.2 | 0.4 | 0.3 | 0 | 0 | 0 | 0 | 0 |
| 0 | 0 | 0 | 0.0 | 0.5 | 0.0 | 0.5 | 0 | 0 | 0 | 0 | 0 |
| 0 | 0 | 0 | 0.5 | 0.0 | 0.5 | 0.0 | 0 | 0 | 0 | 0 | 0 |
| 0 | 0 | 0 | 0.0 | 0.5 | 0.0 | 0.5 | 0 | 0 | 0 | 0 | 0 |
| 0 | 0 | 0 | 0.5 | 0.0 | 0.5 | 0.0 | 0 | 0 | 0 | 0 | 0 |
| 0 | 0 | 0 | 0.0 | 0.0 | 0.0 | 0.0 | 0 | 1 | 0 | 0 | 0 |
| 0 | 0 | 0 | 0.0 | 0.0 | 0.0 | 0.0 | 0 | 0 | 0 | 0 | 0 |
| 0 | 0 | 0 | 0.0 | 0.0 | 0.0 | 0.0 | 0 | 0 | 0 | 1 | 0 |
| 0 | 0 | 0 | 0.0 | 0.0 | 0.0 | 0.0 | 0 | 0 | 0 | 0 | 0 |
| 0 | 0 | 0 | 0.0 | 0.0 | 0.0 | 0.0 | 0 | 0 | 0 | 0 | 0 |